Instructional Design with Orchestration Graphs
EPFLInstructional Design with Orchestration Graphs
Discover a visual language for designing pedagogical scenarios that integrate individual, team and class wide activities.
Imagine you want to design the following educational scenario. First, your students solve a problem individual. Next, you form pairs of students who obtained different solutions and ask them to choose the best of their two solutions. Finally, you display the produced solutions and compare them in your final lecture. This scenario needs to be managed dynamically: collecting individual solutions, forming pairs, collecting pair solutions and displaying them. It also requires opportunistic timing: you would like all individuals to complete their solution before moving to the team activity but you don’t want to have many students waiting too long because one has not yet finished. These operations (timing transitions, collecting data, forming pairs) implement the orchestration of the designed scenario.
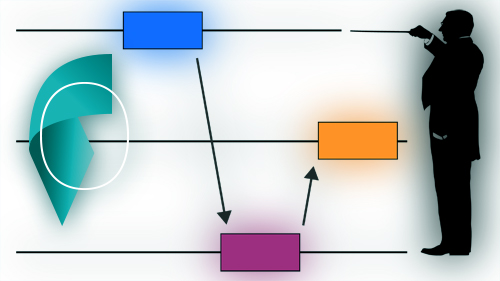
For designing this kind of lesson plan, this MOOC proposes a visual model, called orchestration graph. The vertices of the graph are the learning activities. Learners perform some of these activities individually; some activities are done in teams and some with the whole class. The edges of the graph connect consecutive activities. They are associated to operators that transform the data structures produced by learners during a learning activity into the data structures necessary to run the next activity. A graph of operators hence constitutes a workflow. The edges also describe why an activity is necessary for the next activity: is it a cognitive pre-requisite, a motivational trick, an advanced organizer, an organizational need, etc.
The participants will first acquire the concepts by sketching graphs on paper and will next learn to use FROG, an online platform for Fabricating and Running Orchestrating Graphs.
In this MOOC, you will learn
- Why some lesson plans require more correct orchestration
- How to design a lesson plan that takes benefit of multiple learning activities
- How to maximize the effectiveness of collaborative learning
- How to design graphically an orchestration graph
- What are possible edges of the graph inspired by education research
- What are possible operators in the dataflow
- How to edit, share and execute graph in FROG
- What is the optimal timing for transition between activities
Syllabus
- Introduction to orchestration graphs: Get the key concepts and draw a simple graph on paper. Start weekly live session with instructors.
- Optimizing collaborative learning: Learn how an orchestration graph enhances learning from teamwork and discover the FROG platform.
- Inside orchestration graph: Explore the range of edges and operators to be assemble to a graph.
- Orchestration: Predict when an activity will be completed by how many students? Invent and implement your own orchestration graph.
- Final debrief: After week 4, you will have 5 weeks to finalize your orchestration graph and possibility test with students. Get feedback from the teachers and share your experience with other participants.
Instructors

Pierre Dillenbourg, full professor
Pierre Dillenbourg is professor in learning technologies in the School of Computer & Communication Sciences, at the Swiss Federal Institute of Technology in Lausanne (EPFL). A former teacher in elementary school, he graduated in educational science (University of Mons, Belgium). He started his research on learning technologies in 1984. He obtained a PhD in computer science from the University of Lancaster (UK), in the domain of artificial intelligence applications for education. He is a fellow of the International Society for Learning Sciences.
Areas of expertise:
- learning technologies (AI, AR, robotics, tangibles)
- computer-supported collaborative learning
- vocational education & training
- human-computer interaction
Major works:
- Director of the leading house ‘technologies for vocational education systems’
- Former academic director of Center for Digital Education (over 2 million MOOC registrations)
- Co-founder of the Swiss EdTech Collider, an incubator with 90 start-ups in learning technologies
- Co-founder of the EPFL Center of Learning Sciences
Other EPFL MOOCs
You'll find more information about EPFL MOOCs here. This course in particular might be of interst to you: Foundations of Teaching Science and Engineering.

How to navigate through this course
Start the course by clicking on the below menu.
If you are new to edX and would like to learn how to navigate the edX platform, take this fun and interactive demo course designed to help you explore the edX learning experience. It is perfect to take before you start this present course.